Fact Pack! Election Edition
By Hightower Las Vegas and RCG Economics on November 4, 2025
Remember when Nevada was once the fastest-growing state, year in and year out? Good times. The following graphics show America’s fastest-growing states based on projections for the years between 2025 and 2050, per data from the University of Virginia.
Nevada is ranked 11th for percentage growth (27 percent) over that time period when compared to all other states, and is 4th in the Mountain West — after Utah (35 percent), Idaho (30 percent), Colorado (29 percent), and Washington (28 percent):

Data as of 2024
Forecasts as of Q2 2025
Most growth is projected to occur in the West and South, with the exception of New Mexico, Wyoming, Louisiana, and Mississippi:

Data as of 2024
Forecasts as of Q2 2025
Note that 18 states are projected to shrink by 2050, two in the Mountain West: Wyoming (-4 percent) and New Mexico (-2 percent).
Texas is projected to gain 8.6 million residents by 2050, the highest absolute increase across states. Florida and California are expected to add 5.2 million and 3.1 million people, respectively, and Washington State and Colorado round out the top five.
High-growth states by percentage:

Data as of 2024
Forecasts as of Q2 2025
Reapportionment
The nonpartisan Brennan Center estimates that if trends continue, the South will gain nine congressional seats after the next census — the largest single-decade gain for the region in history. Florida and Texas are forecast to see especially large increases — four seats each — and North Carolina also would see its congressional delegation increase by one seat.

Source: Brennan Center As of July 2024
The potential gains will be driven overwhelmingly by communities of color. Census data released earlier this year shows that between 2022 and 2023, more than 84 percent of population growth in the South came from increases in the region’s Black, Latino, and Asian populations. The vast majority of growth was in four states: Florida, Georgia, North Carolina, and Texas.
On the flip side, California and New York, which have seen significant population outflows over the last 10 years, are projected to lose four and two districts, respectively. For California, it would be the second time in its history it has lost representation. Illinois, Minnesota, Oregon, Pennsylvania, Rhode Island, and Wisconsin all are forecast to see one-seat decreases.
If the estimates hold, the South would have a record 164 seats in the House next decade, meaning nearly 4 in 10 members of the House would be southerners.

Source: Brennan Center As of July 2024
Electoral College Math
In 2024, Democratic presidential nominee Kamala Harris would have won the Electoral College vote by winning the states she carried, plus Nebraska’s 2nd Congressional District (Nebraska allocates some electoral votes by district), plus three battleground states: Michigan, Pennsylvania, and Wisconsin — and her campaign spending reflected it.
By 2032, that strategy may be tossed in the trash by Democrats. Given the expected shift of electoral votes to the South, even if a Democrat were to carry the three “Blue Wall” states and win both Arizona and Nevada in 2032, the result would be a very narrow 276–262 win.
Election Month
Ever wonder how Election Day ended up on a Tuesday?
Prior to 1845, states could hold elections whenever they wished within a federally designated 34-day period ending on the first Wednesday in December. As modern This-just-in! news media became a thing, early voting results were deemed to be influencing last-minute voters so Congress passed the Presidential Election Day Act of 1845.

Source: Statutes and Stories
Because American society was substantially rooted in agriculture in the mid-19th century, November was chosen for its timing after the harvest. Because it took a full day of travel for many people to reach a polling place, that churchgoing made weekends impractical, and that Wednesday was market day for many farmers, Tuesday was deemed best.
Historic Turnout
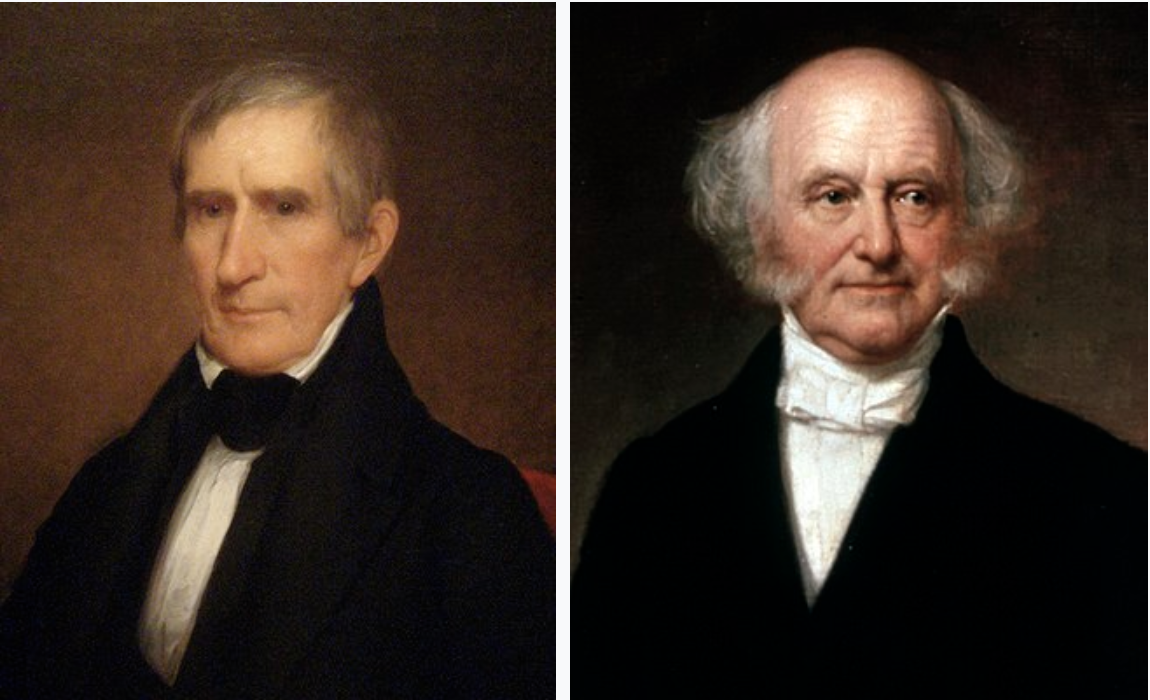
Our election reading this week included discovery of interesting details about the 1840 Presidential election, in which incumbent President Martin Van Buren lost to war hero William Henry Harrison. Known for his victory at the Battle of Tippecanoe, Harrison had a broad appeal to common voters and farmers, who perceived Van Buren as too aristocratic.
Domestic unrest because of the depression led to remarkably high voter turnout: It reached 80 percent in many states.

Source: Statutes and Stories
Though Van Buren received 400,000 more popular votes than any prior presidential candidate, the total number of votes cast increased 60 percent, from 1.5 million in 1836 to 2.4 million in 1840. It is to this day the largest proportional increase between consecutive elections in American history — and notably, it included actual election-rigging.
Voter fraud was possible because voter registration was not required, and different states held elections on different days, enabling “floaters” to cross state lines to vote in another state after voting in their own. The practice was often called “pipe-laying,” because floaters challenged by local officials were told by political organizers to reply that they were in town to help lay pipes.
Another form of fraud involved “repeaters,” a scenario where voters changed their clothes and altered their appearance to vote in different local precincts.
Election stats from days past:

Source: Interesting Facts
Boozy Budget
George Washington fans may know he was a member of the Virginia House of Burgesses who lost his first election — and “attributed his defeat to his failure to provide enough alcohol for the voters,” according to biographer and author Daniel Okrent.
At the time, it was common for candidates to offer voters food and liquor. Seeking to avoid his “mistake” the next time around, Washington reportedly spent his entire campaign budget on:
- 28 gallons of rum
- 50 gallons of rum punch
- 34 gallons of wine
- 46 gallons of beer, and
- 2 gallons of cider royal
served to 391 voters — nearly a half-gallon per voter.
His campaign team even rolled barrels of liquor to polling places on Election Day, a custom in Virginia and elsewhere — despite being technically illegal.
Air Mobility
Political campaigns may soon involve moving about the country and its regions by way of advanced air mobility (AAM) — one of the fastest-growing segments in aviation. Firms such as Surf Air are creating digital infrastructure and using highly automated aircraft to optimize regional and local air travel, often on smaller planes and other aircraft at smaller, commuter airports.
The benefit for travelers includes saving time and avoiding the many hassles of navigating large air hubs and flying on large planes. This graphic nicely frames the advanced air mobility space:

Source: Surf Air As of 11/3/25
Such systems will rely on existing and new aircraft, including eVTOLs (electric vertical takeoff and landing vehicles), battery-electric, and hydrogen propulsion aircraft, and will range from personal air taxis to multi-person transport to small cargo planes. Examples:
- Urban Air Mobility (UAM): Efficiently moving people within urban areas and surrounding suburbs.
- Regional Air Mobility (RAM): Connecting cities and towns in a region
- Cargo delivery: Transporting goods such as groceries and medical supplies
- Public services: Aiding emergency responders and other public safety efforts
The FAA and Department of Transportation are working with domestic and international partners to develop a regulatory framework, and certificates and degrees — such as a Master in Advanced Air Mobility (MAAM), an executive MBA program — are popping up across the globe.
NASA also has a program (informational video can be viewed here).

Source: NASA As of 11/3/25
Upside Down
Whatever the outcome of the next few elections, rising government debt will continue to be a topic of debate. The U.S. ($38.3 trillion) and China ($18.7 trillion) are the two countries with the most government debt, together accounting for just over half of the world’s total debt — approximated at $110.9 trillion.
Japan, the UK, and France round out the five countries with the most government debt and together make up 67 percent of the world’s government IOUs, and the top 10 nations make up 81 percent.

As of October 2025
Government debt in the U.S. grew by $2.9 trillion in 2025, while China’s grew by $2.2 trillion. Despite having the smaller dollar value, China’s debt grew more on a percentage basis—growing 13.6 percent annually compared to the U.S. debt growth of 8.4 percent.
Note: The visualization shows the countries with the most general government gross debt in 2025 using data from the International Monetary Fund‘s World Economic Outlook earlier this month. More on the methodology and data here.
On the Horizon
